Live trading results
Every trade tracked. Every drawdown owned. Nothing hidden. Performance shown from January 2023 to date.
Net P&L
All
+$96,420
Long
+$58,940
Short
+$37,480
Win Rate
All
64.2%
Long
65.8%
Short
61.9%
Profit Factor
All
2.62
Long
2.78
Short
2.41
Sharpe Ratio
All
2.24
Long
2.38
Short
2.02
Max Drawdown
All
-5.4%
Long
-4.1%
Short
-6.3%
Total Trades
All
812
Long
468
Short
344
Avg Hold (hrs)
All
4.5
Long
5.0
Short
3.8
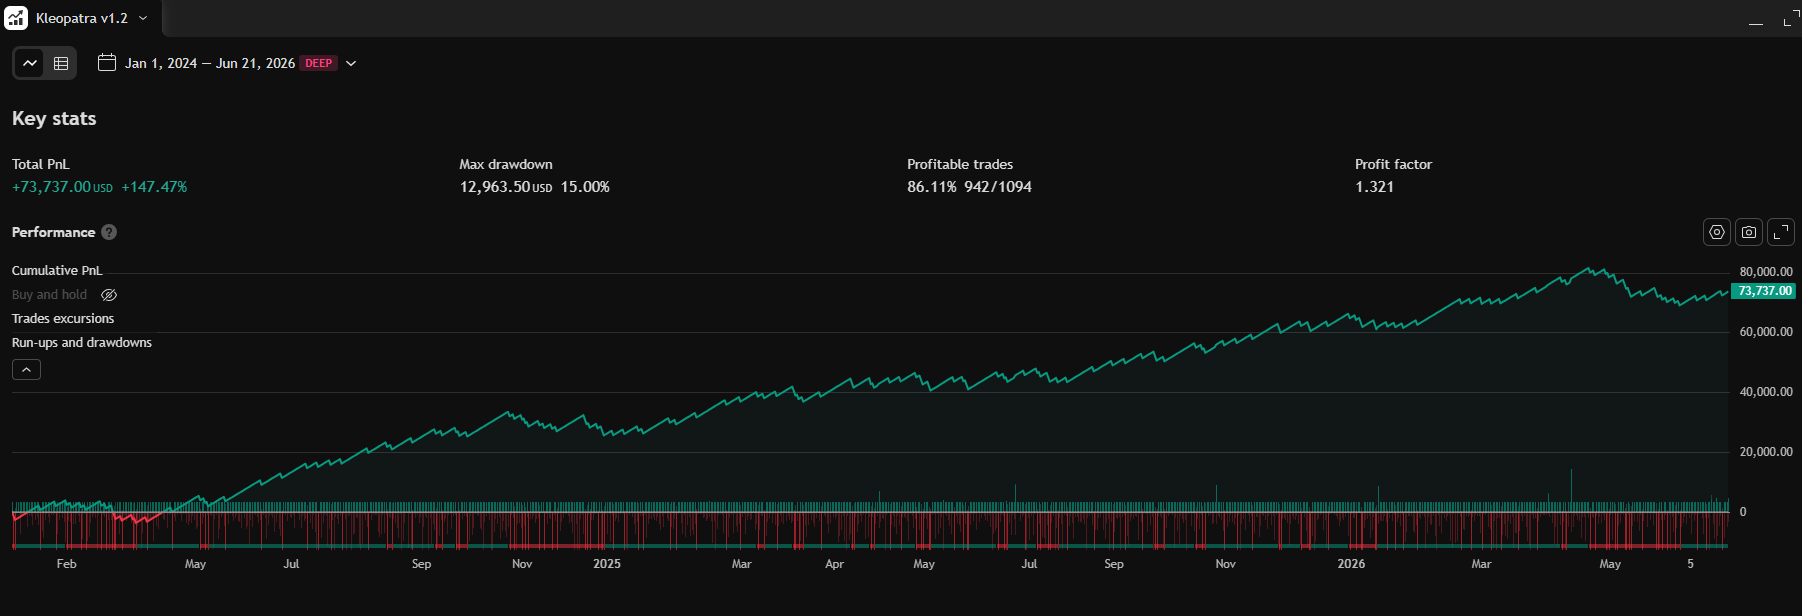
Kleopatra v1.2 — Cumulative P&L
Cumulative P&L from Jan 2, 2024. Daily mark-to-market.
Performance is based on an initial capital allocation of $50,000, utilizing an intelligent, dynamic risk-management model that scales exposure between 1 to 3 MNQ contracts per trade based on market conditions.
Total PnL
+$73,317
Strategy updates
Kleopatra v1.2
June performance update
Trades
84
Win rate
67%
Return
+8.4%
September saw the Kleopatra v1.2 strategy continue its consistent grind, with the volatility regime favoring its core fade setups.
We tightened the take-profit on the second leg to capture more of the snap-back without giving up the runners.
Kleopatra v1.2
Quarterly review
Trades
42
Win rate
58%
Return
+12.1%
The Kleopatra v1.2 model adapted well to the choppy summer range, sitting out the worst chop and re-engaging on the September trend break.
Drawdown stayed within the modeled 1-σ envelope. No parameter changes this quarter.